
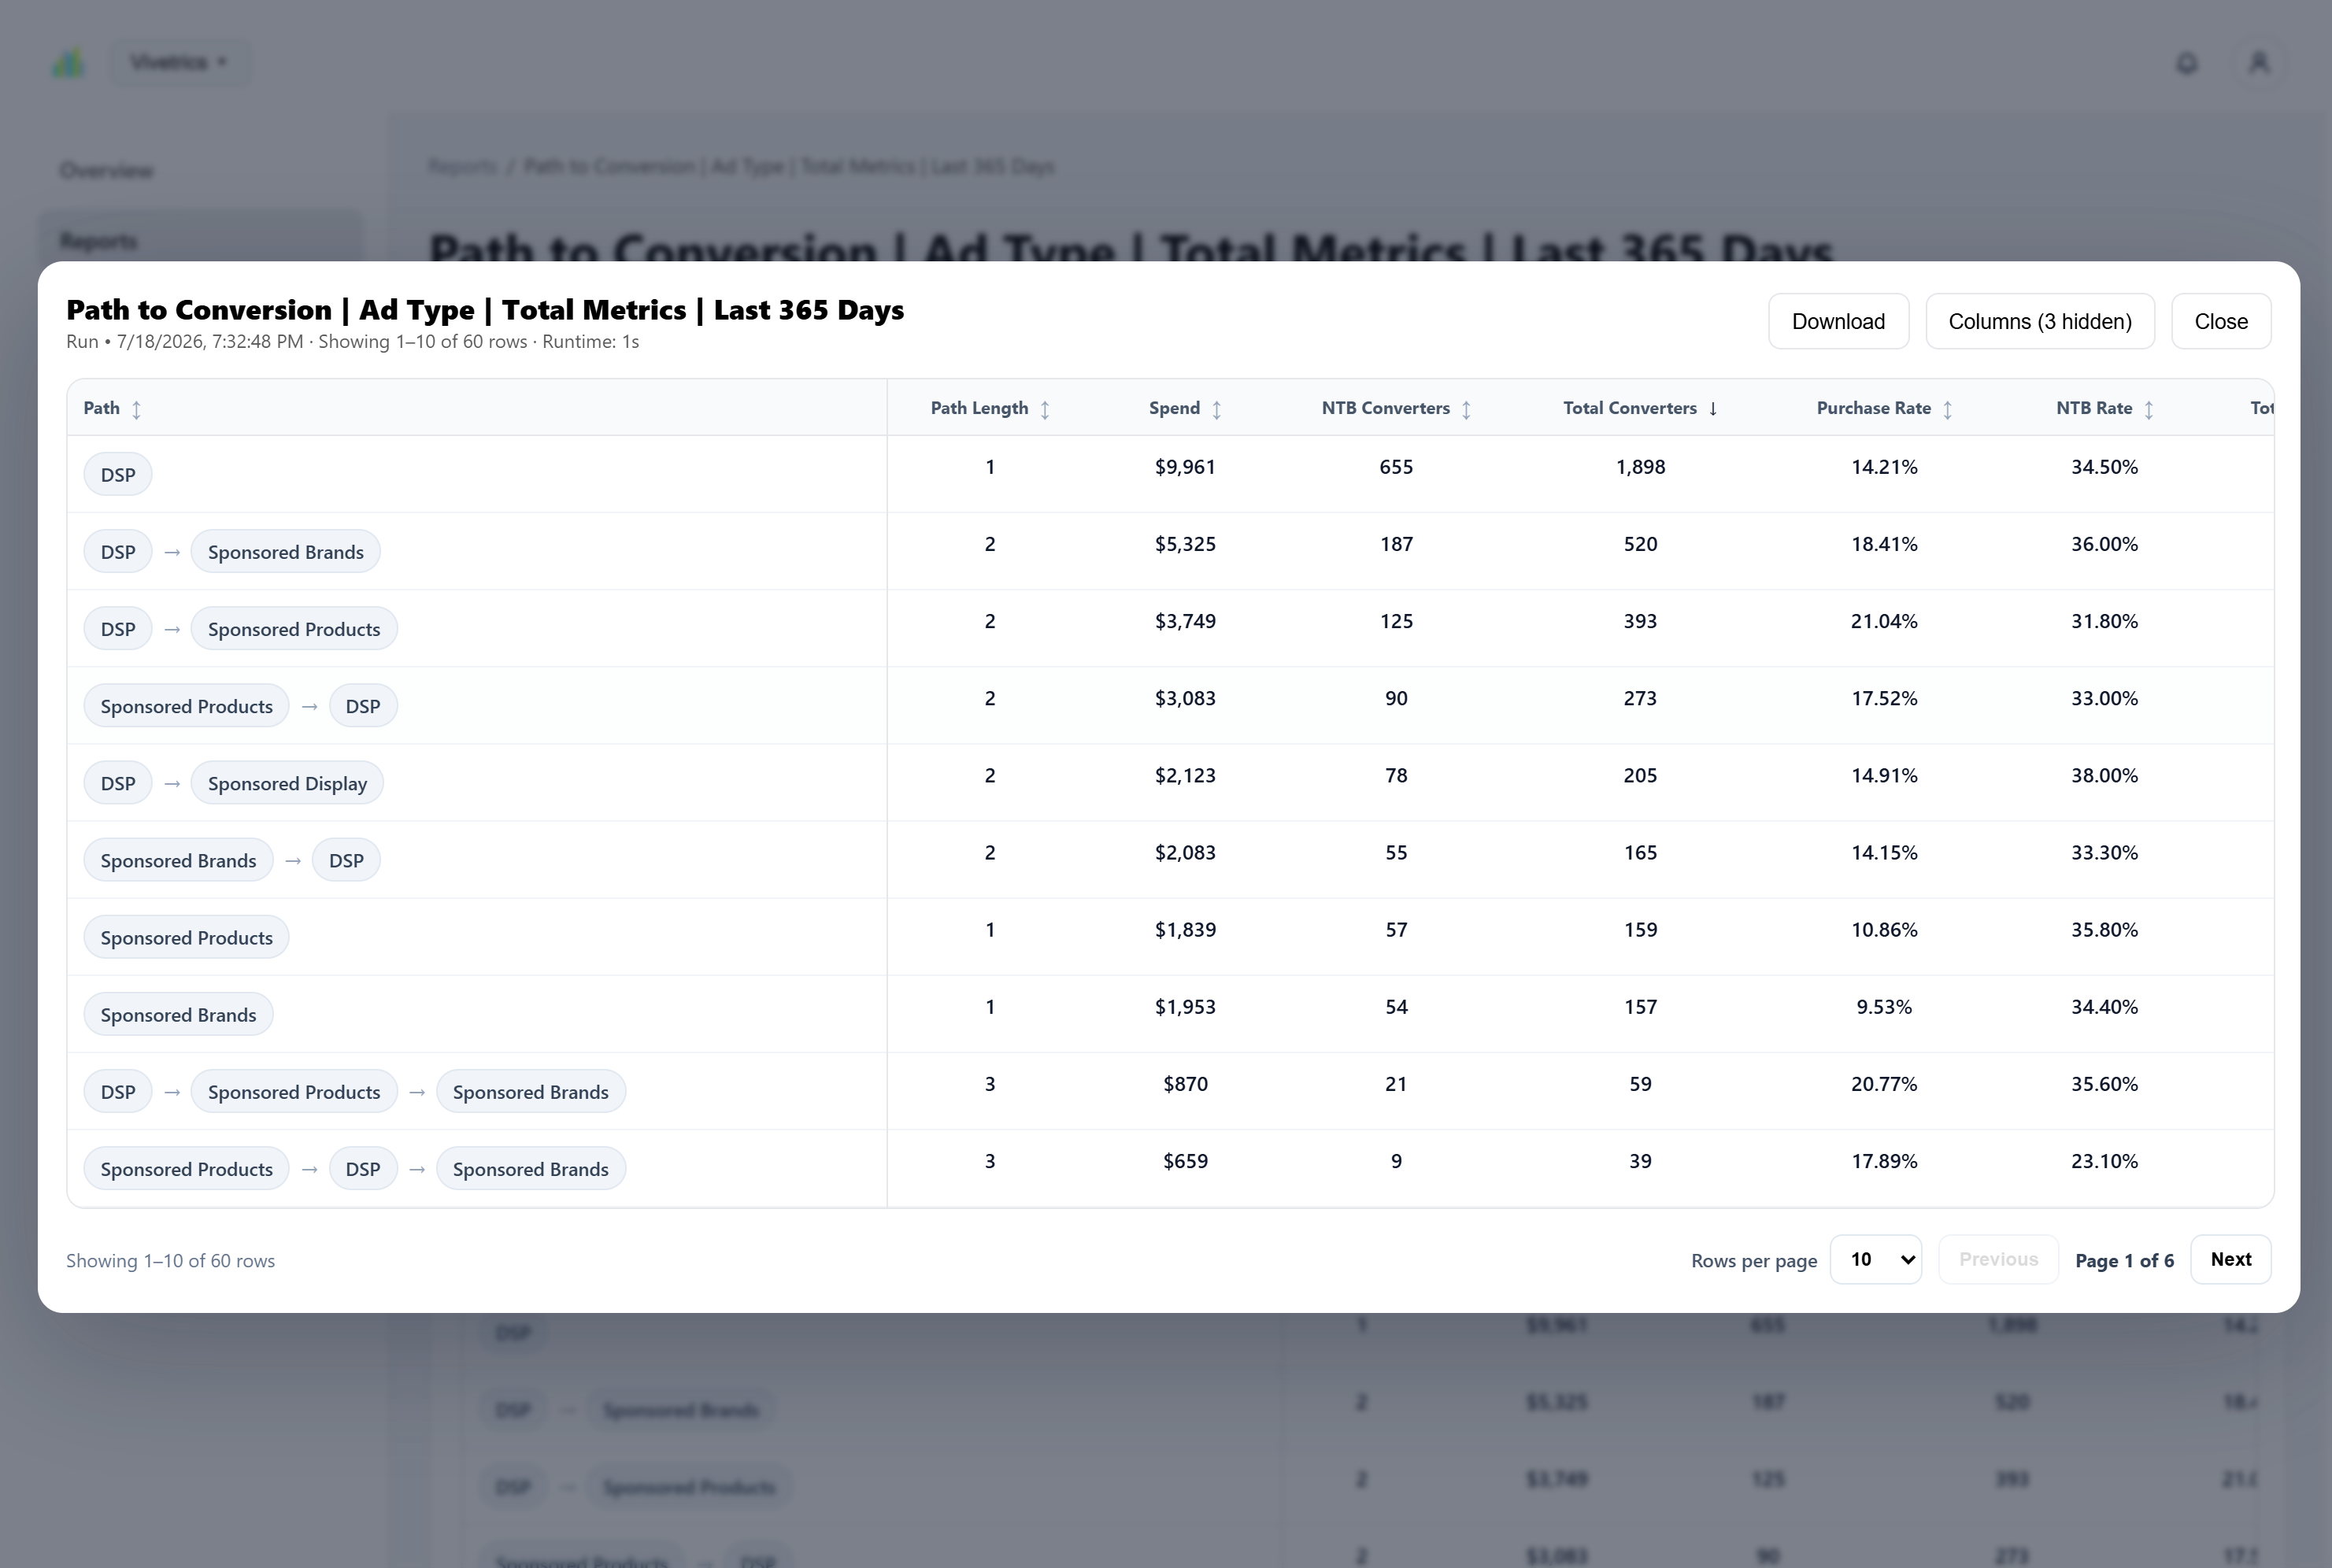
Which touchpoints appear most often in high-value conversion paths?
Amazon Marketing Cloud use cases
Start with the decision - not the dataset or query.
Vivetrics organizes Amazon Marketing Cloud around the questions brands, agencies, and retail media teams need to answer, then connects measurement to interpretation and supported audience workflows.
InsightDecisionActivation
Explore by business question
Six connected ways teams can operationalize AMC.
Each use case begins with a business question and uses the same workspace configuration, mappings, report execution, and decision-support foundation.
01Measurement
Customer journey
Which paths, touchpoints, and transitions are contributing to conversion?
Explore use case02Acquisition
New-to-brand growth
Where are acquisition signals strong enough to optimize or scale?
Explore use case03Retention
Retention and reactivation
Which purchasers are lapsed, and when should re-engagement begin?
Explore use case04Portfolio growth
Cross-sell opportunity
Which product relationships and buyer behaviors deserve deeper investigation?
Explore use case05Planning
Tentpole measurement
How did customer and media behavior change across each event phase?
Explore use case06Activation
Audience strategy
How should a supported insight become a governed audience workflow?
Explore use case01
Customer journey measurement
Understand how customers move across Amazon Ads before conversion.
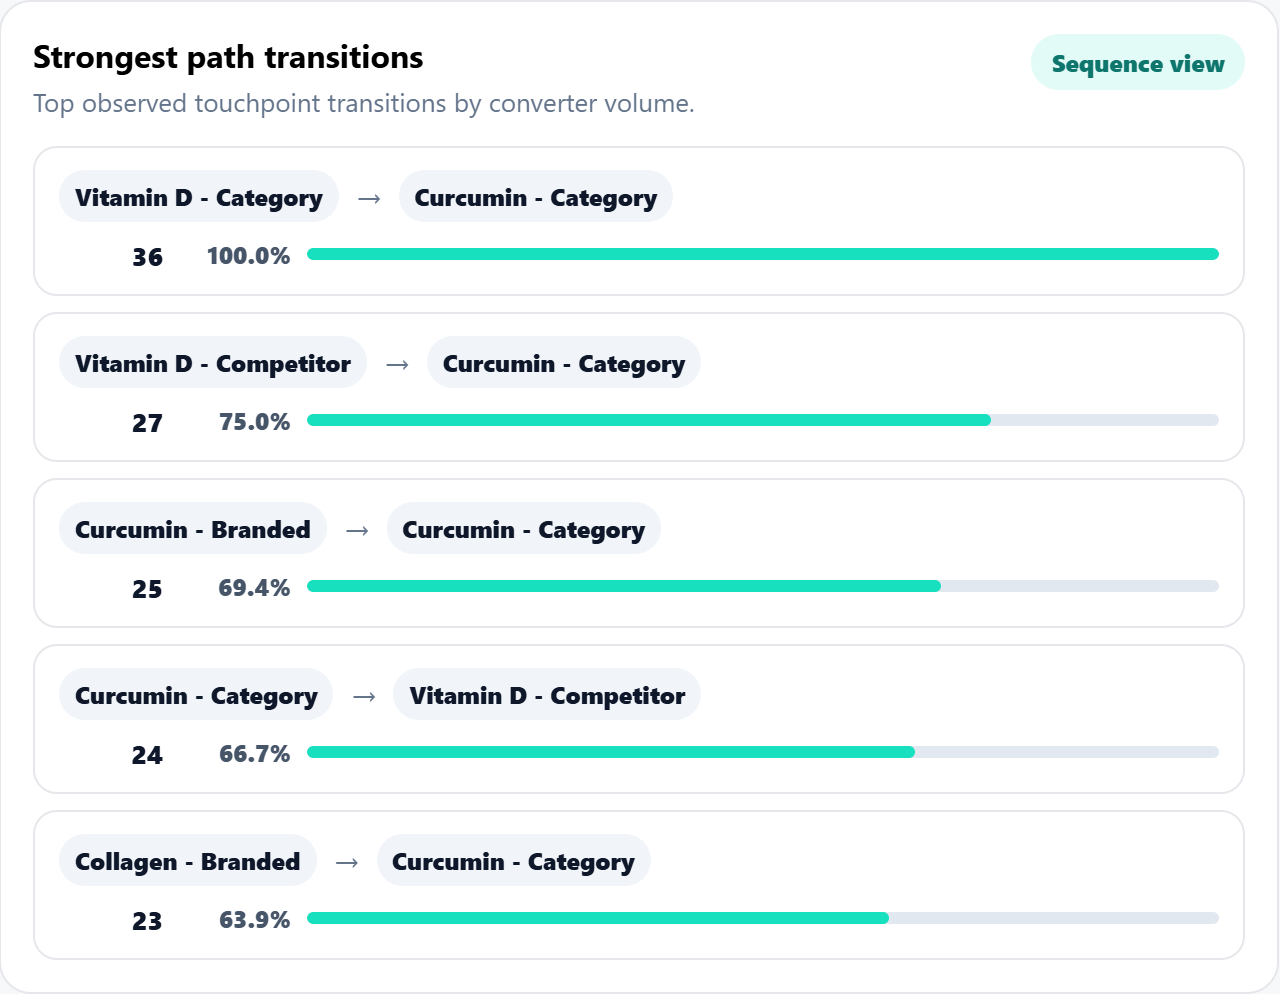
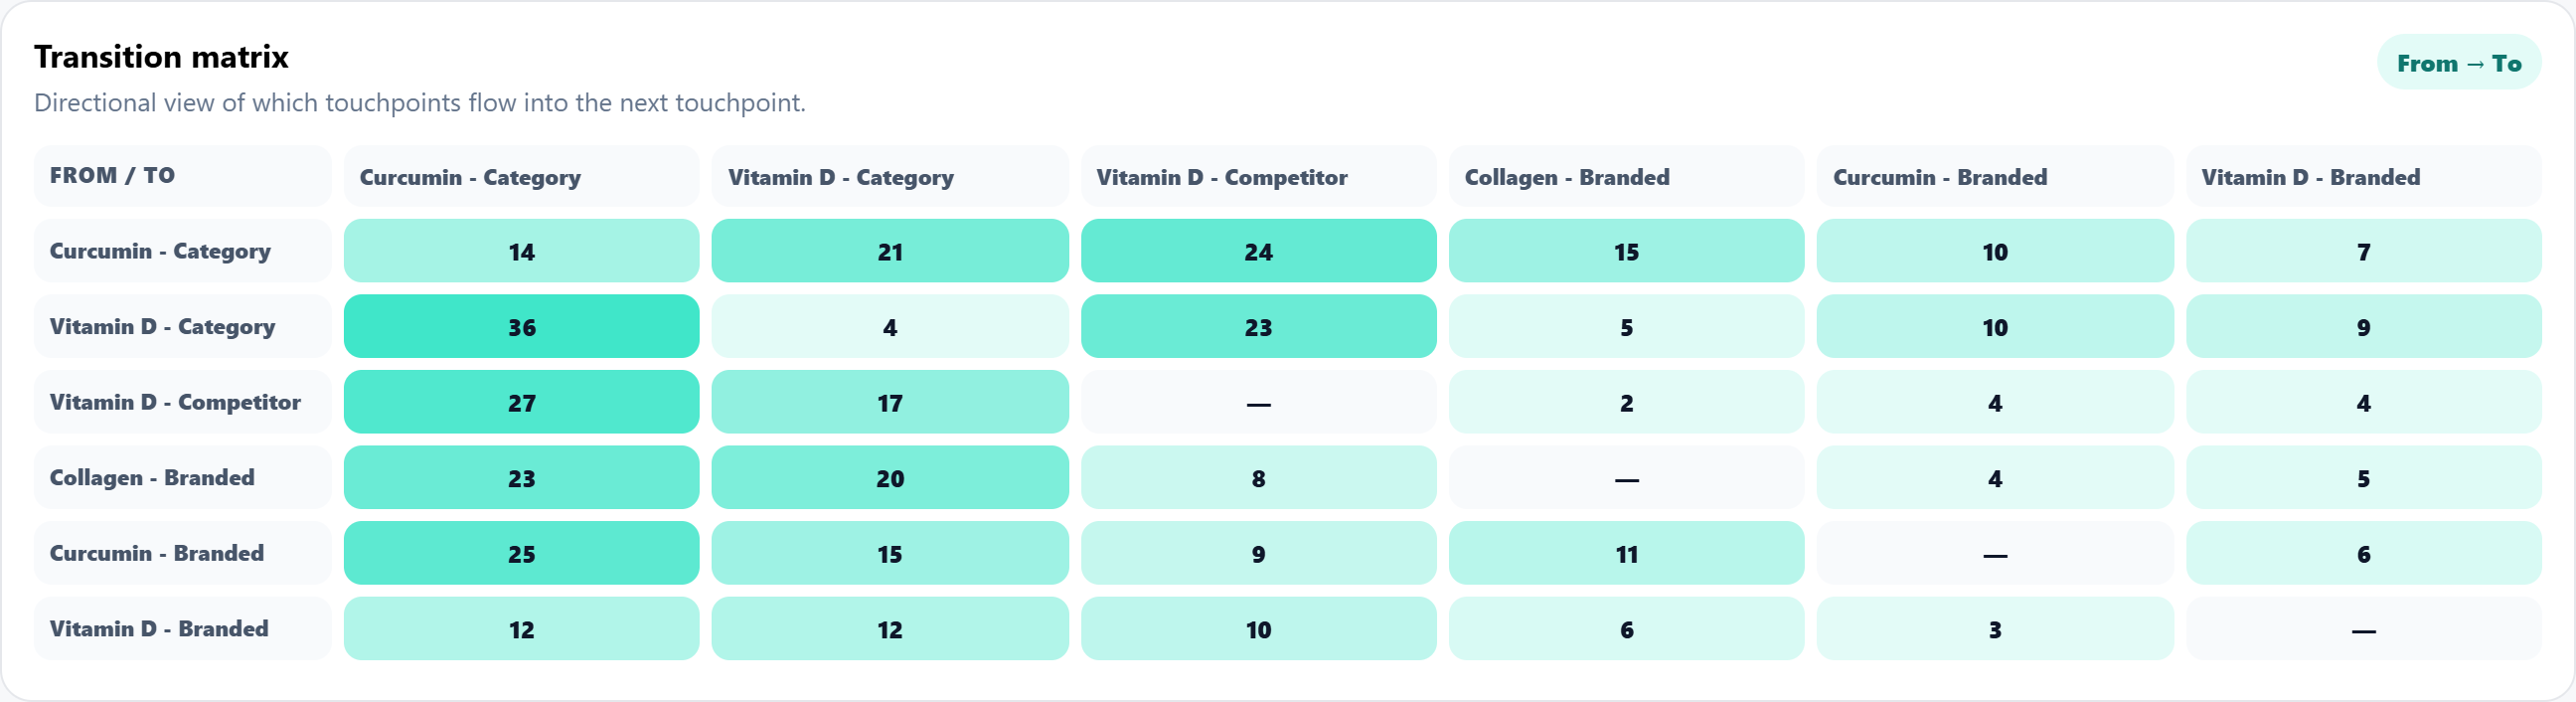
Path-to-conversion analysis can move the conversation beyond a single credited touchpoint by showing the sequences, transitions, and contribution patterns observed in the selected report.
How concentrated is converter volume among the leading paths?
Which paths combine efficient return with stronger acquisition signals?
Where do customers most commonly move from one touchpoint to the next?
Decision supported
Determine which customer journeys, assists, and transitions deserve further investment, optimization, or audience development.
02 · New-to-brand growth
Separate acquisition value from immediate efficiency.
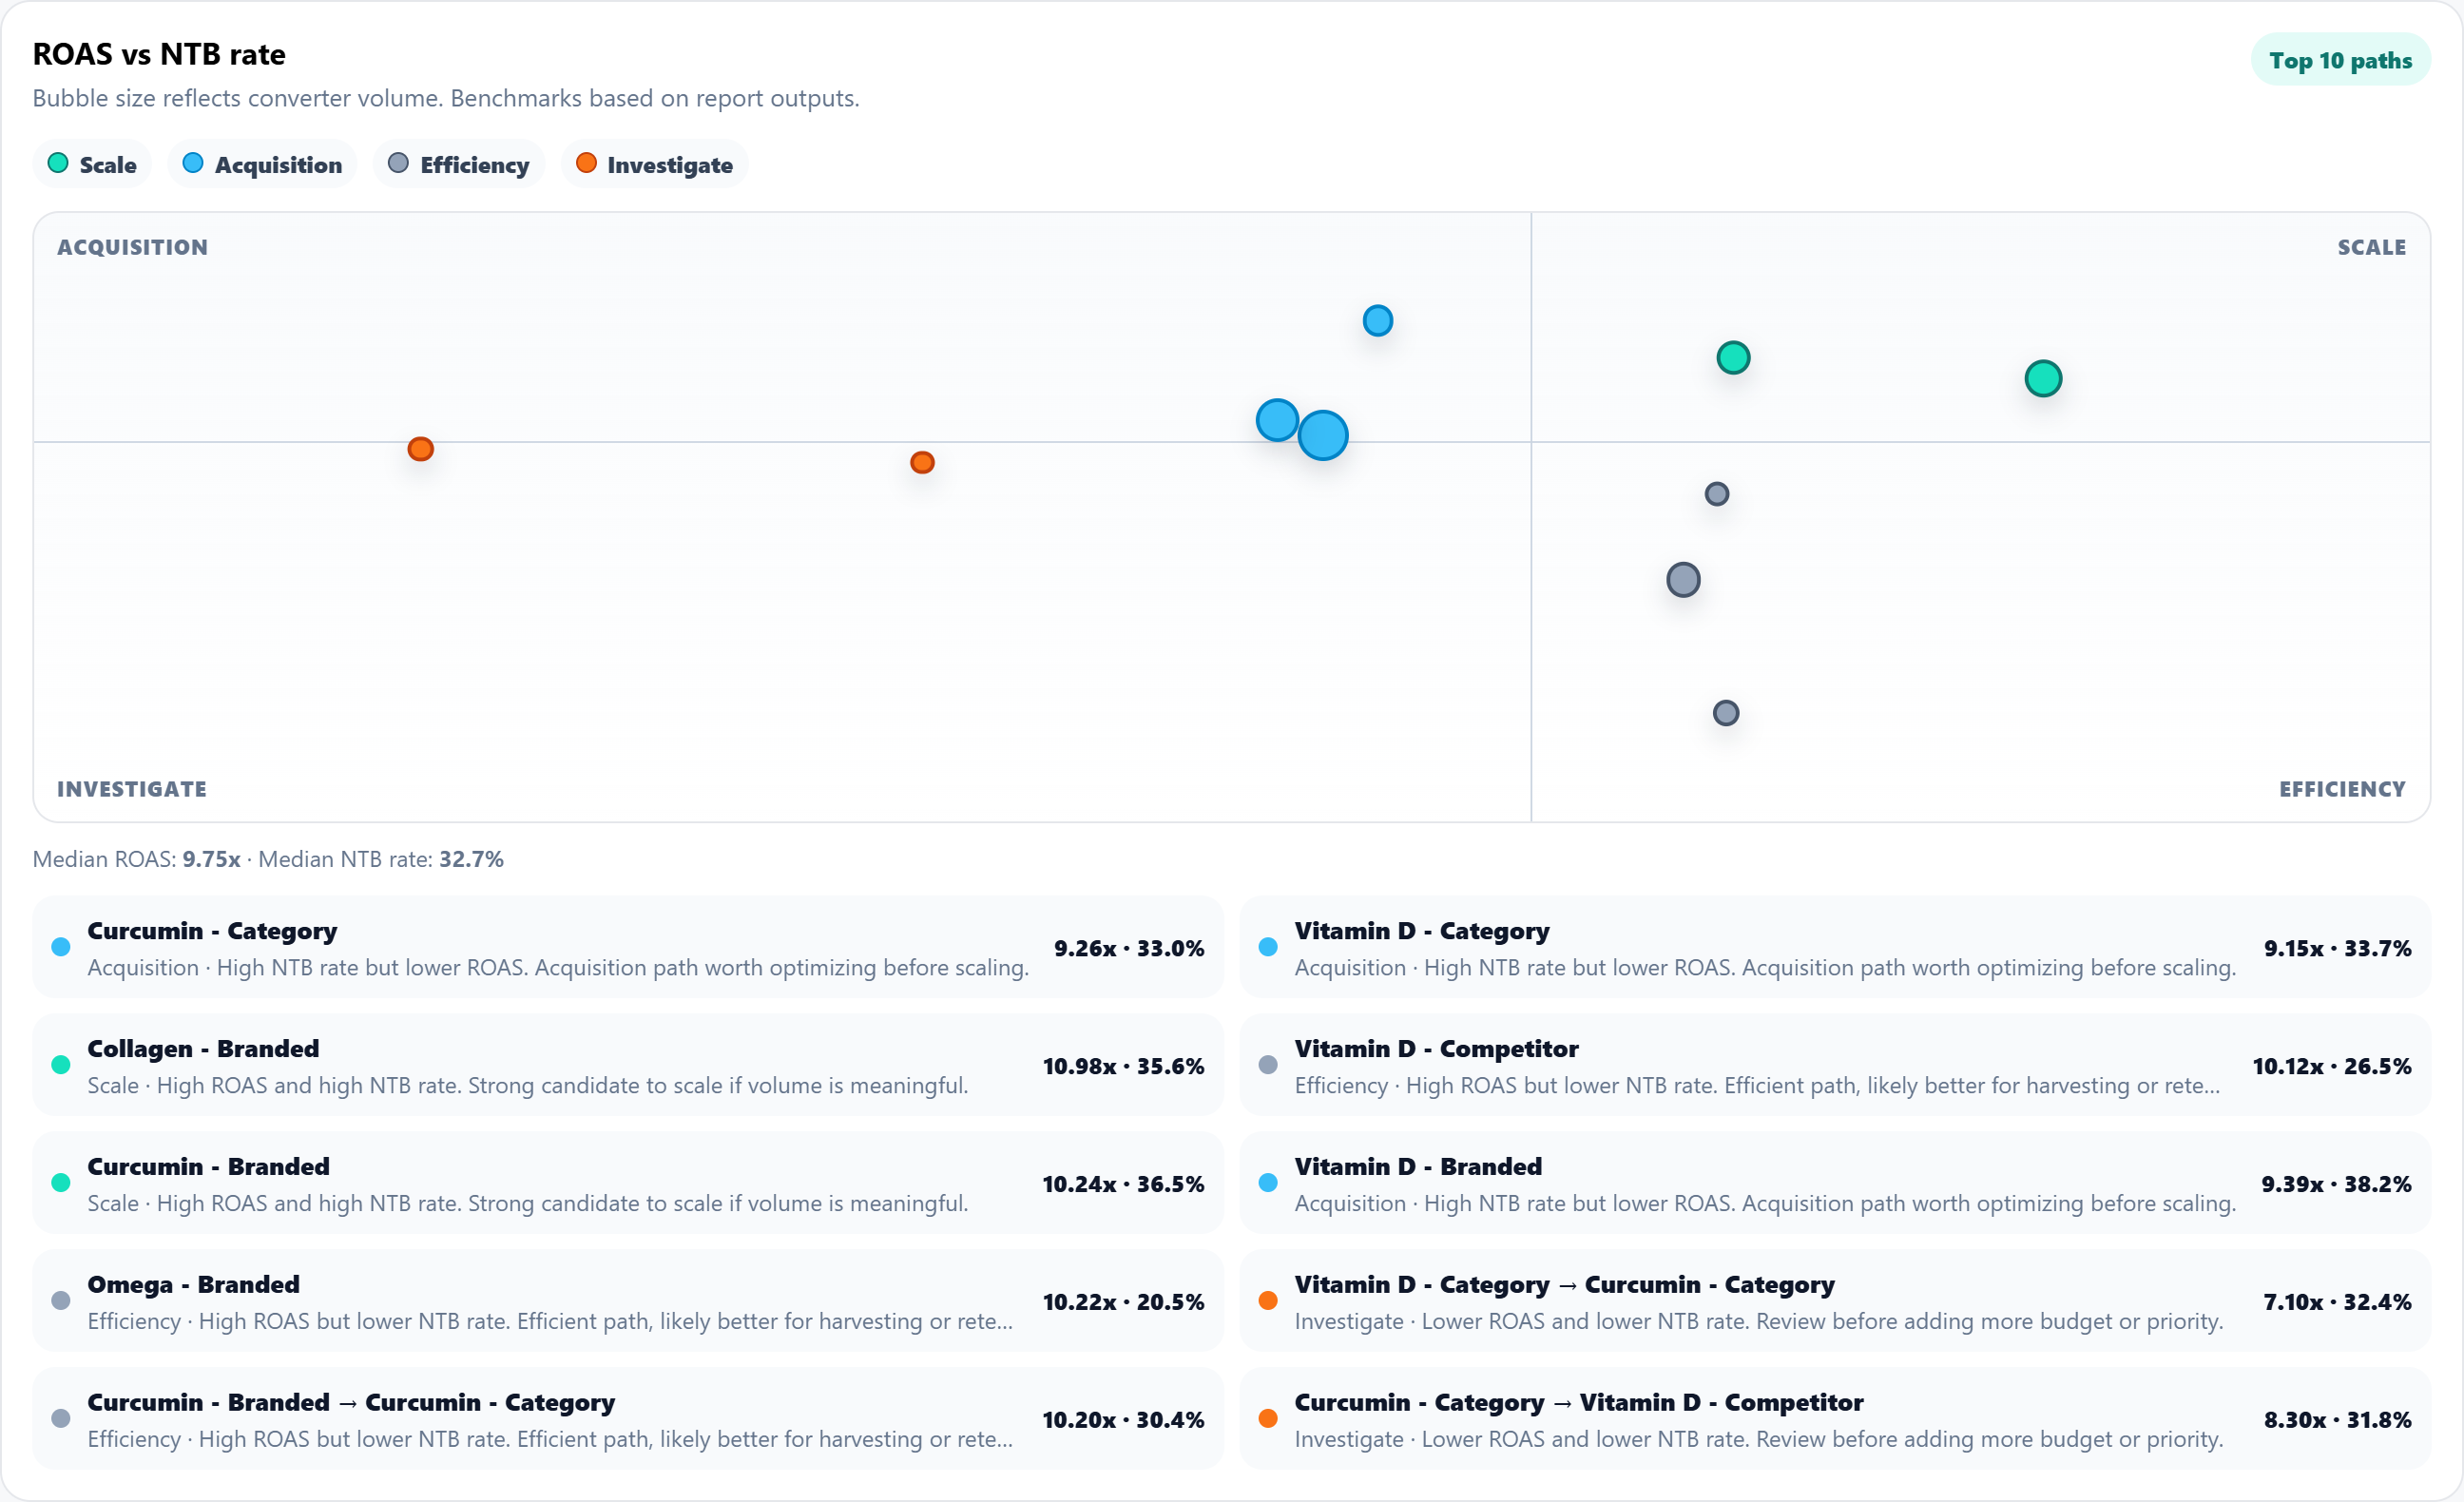
Compare customer paths against selected-report ROAS and new-to-brand benchmarks so teams can distinguish scale, acquisition, efficiency, and investigation candidates.
High ROAS and high NTB rate
Identify paths that may warrant broader support when converter volume and business context are meaningful.
Higher NTB rate with lower relative ROAS
Separate prospecting value from immediate efficiency and determine whether optimization should precede scaling.
Higher ROAS with lower relative NTB
Recognize paths that may be better suited to harvesting, retention, or lower-funnel support.
Below selected-report benchmarks
Surface paths that require closer review before receiving additional budget or strategic priority.
Decision supported
Decide whether a path should be scaled, optimized for acquisition, protected for efficiency, or reviewed before receiving more budget.
03
Retention and reactivation
Find the largest reactivation opportunities - and the right time to pursue them.
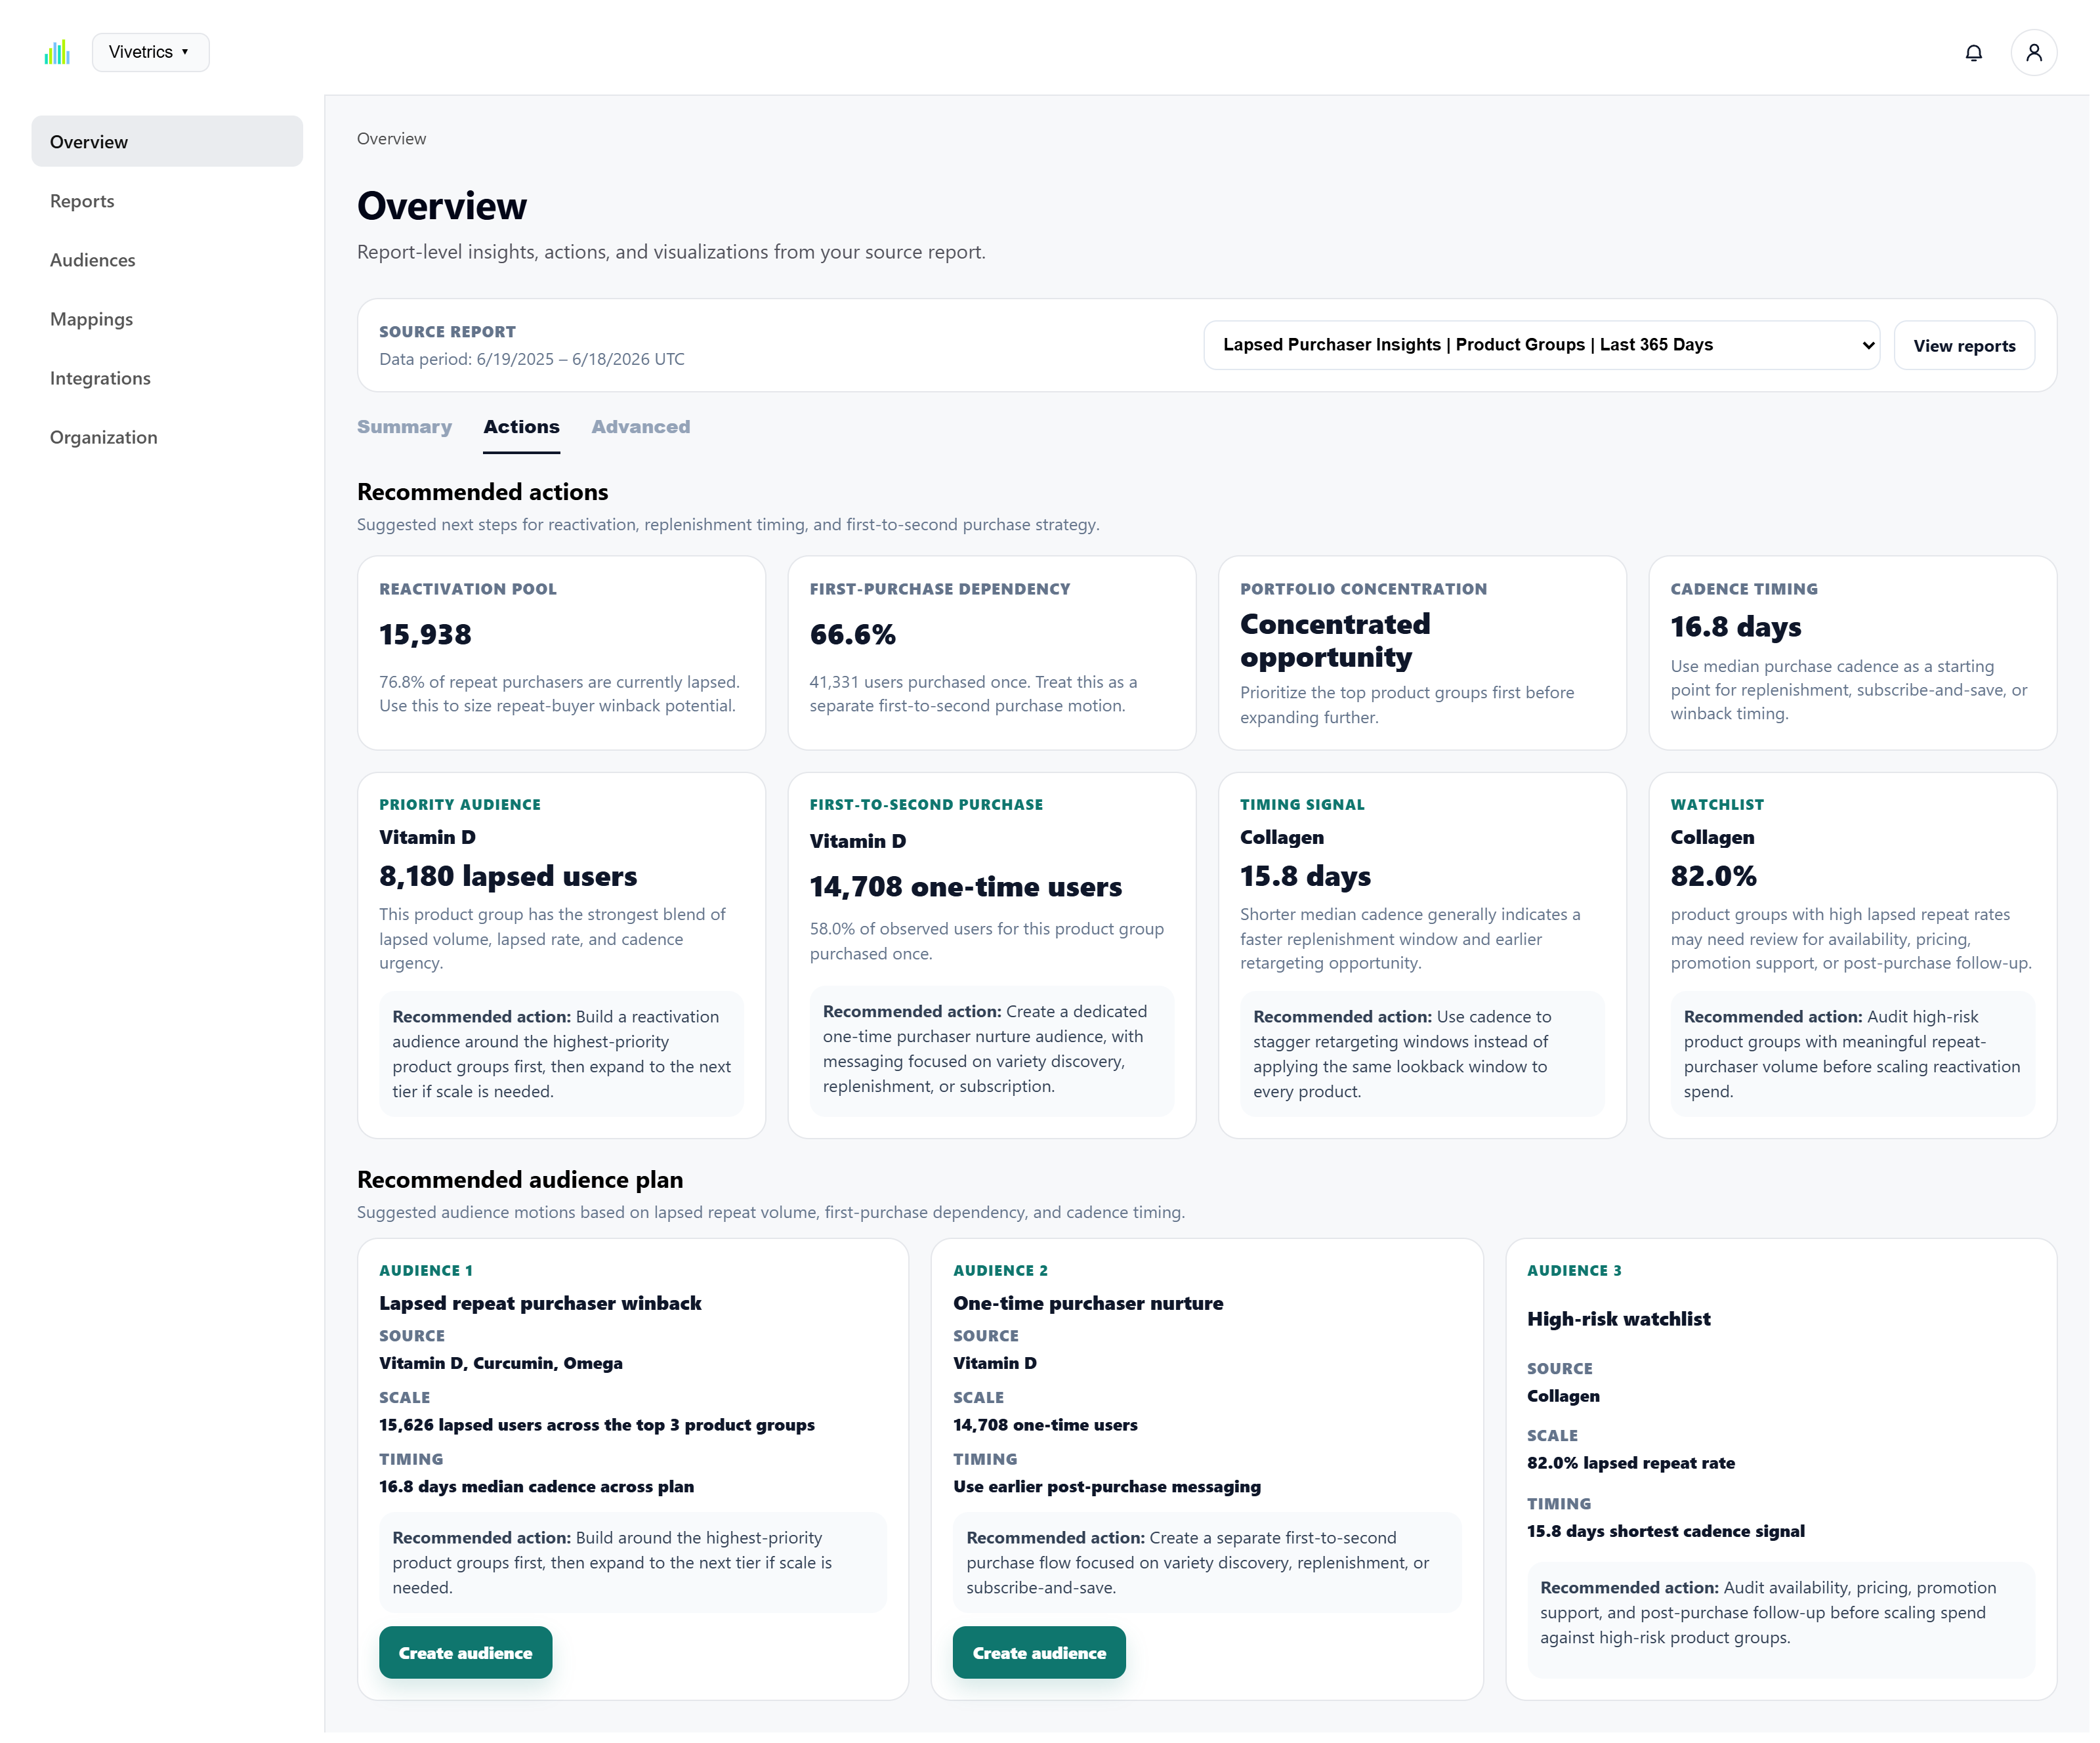
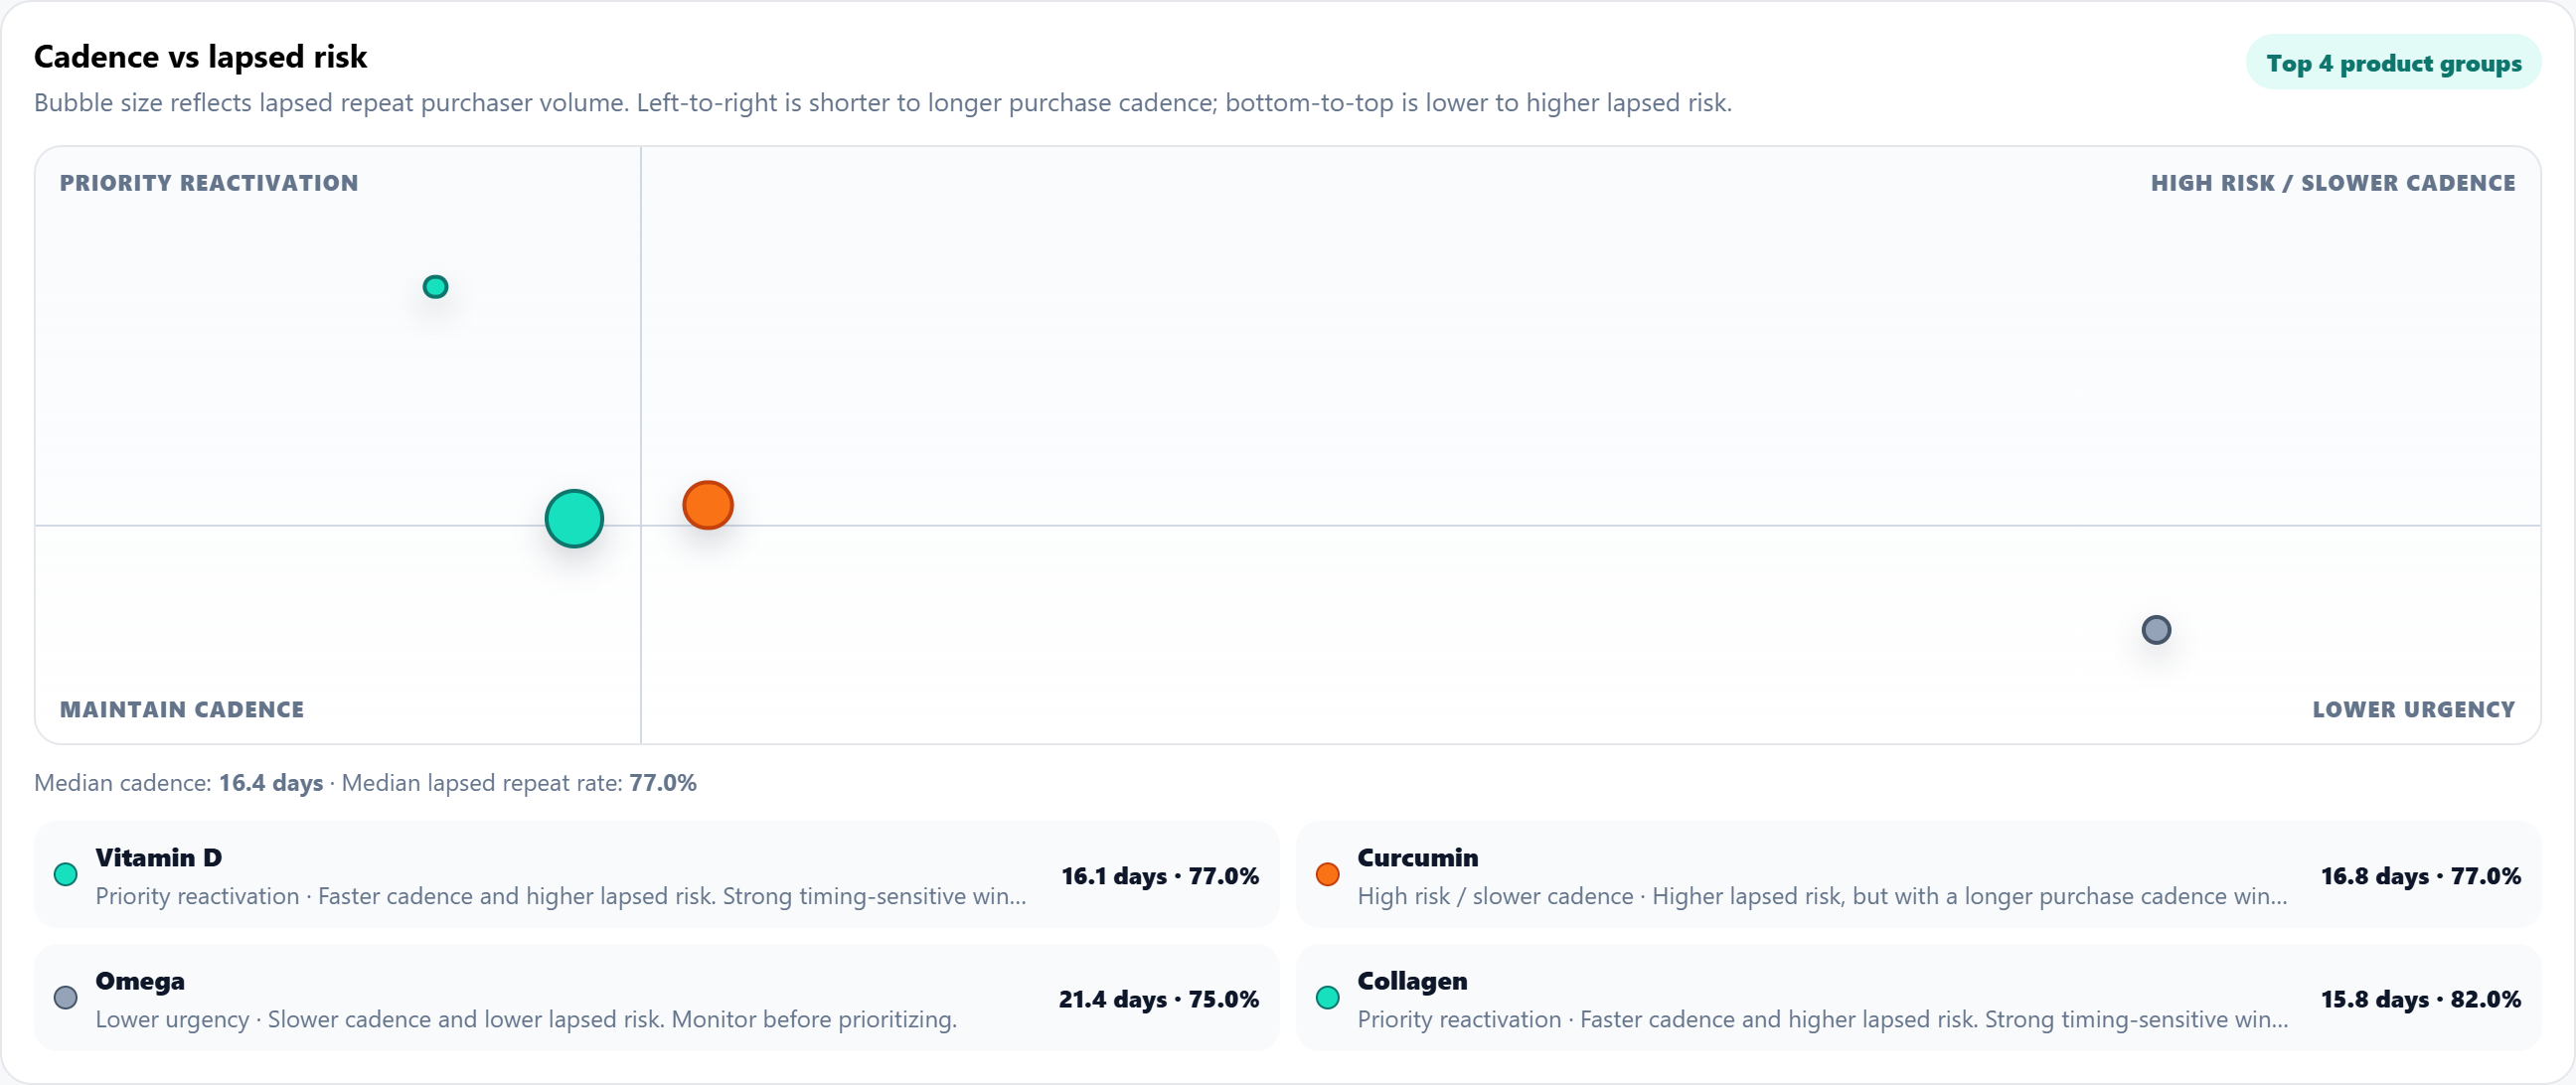
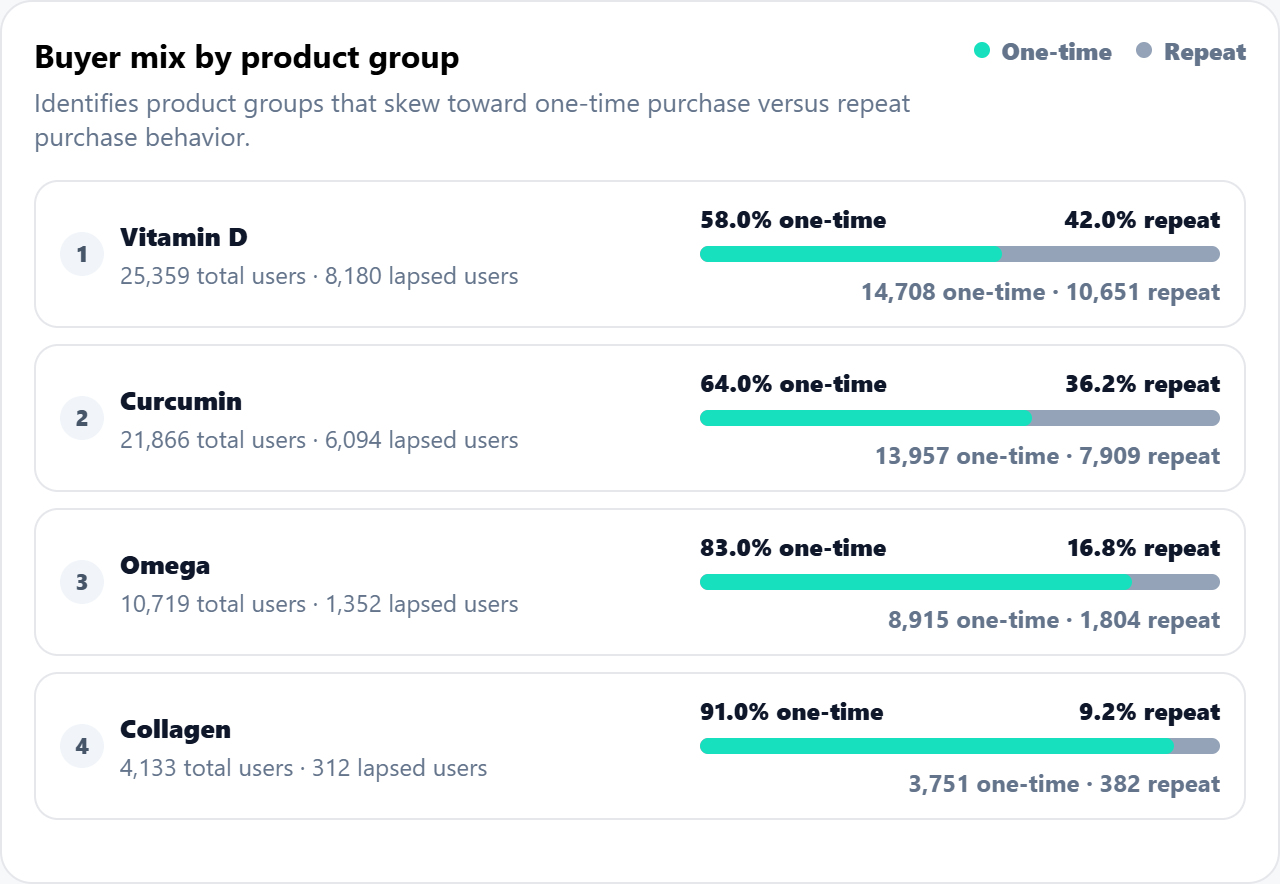
Lapsed purchaser analysis brings buyer composition, repeat behavior, lapse concentration, and purchase cadence into one decision workflow.
Size the opportunity
Understand total purchasers, repeat purchasers, one-time buyers, lapsed users, and the concentration of the opportunity.
Prioritize product groups
Rank product groups using lapsed volume, lapsed-repeat rate, purchase cadence, and buyer composition.
Plan the timing
Use observed cadence as a starting point for replenishment, winback, and first-to-second purchase timing.
Prepare the next motion
Translate supported findings into a reactivation, nurture, watchlist, or follow-up audience plan.
Decision supported
Prioritize winback, first-to-second purchase, replenishment, and risk-watchlist motions using observed purchase behavior.
04 · Cross-sell and portfolio growth
Use portfolio behavior to identify the next opportunity worth testing.
Cross-sell strategy should begin with evidence about existing purchaser relationships, product-level behavior, exposure, and repeat-purchase patterns - not only an assumption that two products belong together.
Where is repeat behavior already established?
Compare product groups by repeat-purchaser concentration before designing a cross-sell or replenishment strategy.
Where is first-purchase dependency highest?
Identify product groups with larger one-time buyer pools that may benefit from a dedicated second-purchase motion.
Which relationships warrant a hypothesis?
Use product, path, purchase, and exposure behavior to determine which cross-sell relationships deserve further analysis.
01Observe
Review purchaser, exposure, and product-group behavior.
02Form the hypothesis
Identify the source and target relationship worth testing.
03Define the audience
Apply purchase, exposure, recency, and exclusion logic.
04Measure the follow-up
Re-evaluate the audience and subsequent purchase behavior.
Decision supported
Determine which cross-sell hypotheses deserve audience development, messaging support, or further measurement.
05
Tentpole measurement
Treat the event as a customer-behavior window - not only a single performance total.
Use AMC reporting windows, source-specific date logic, and consistent mappings to compare lead-in, event, and lead-out behavior across Amazon DSP and Sponsored Ads.
Lead-in
Establish the pre-event baseline, early reach, consideration behavior, and audience buildup.
Event window
Measure event-period reach, exposure mix, conversion behavior, customer paths, acquisition, and sales outcomes.
Lead-out
Evaluate residual response, delayed conversion, repeat behavior, and post-event audience opportunities.
Questions the workflow can support
Build the recap around behavior, contribution, and what remains actionable.
- How did reach, frequency, spend, and conversion change by phase?
- Which ad types and tactics worked together during the event?
- Which customer paths appeared during lead-in versus the event window?
- Did the event generate new-to-brand or repeat-purchase opportunity?
- Which exposed or engaged audiences remain actionable afterward?
Decision supported
Explain how the event unfolded, which tactics contributed, and what should change before the next tentpole.
06 · Audience strategy
Turn a supported strategy into an explicit audience configuration.
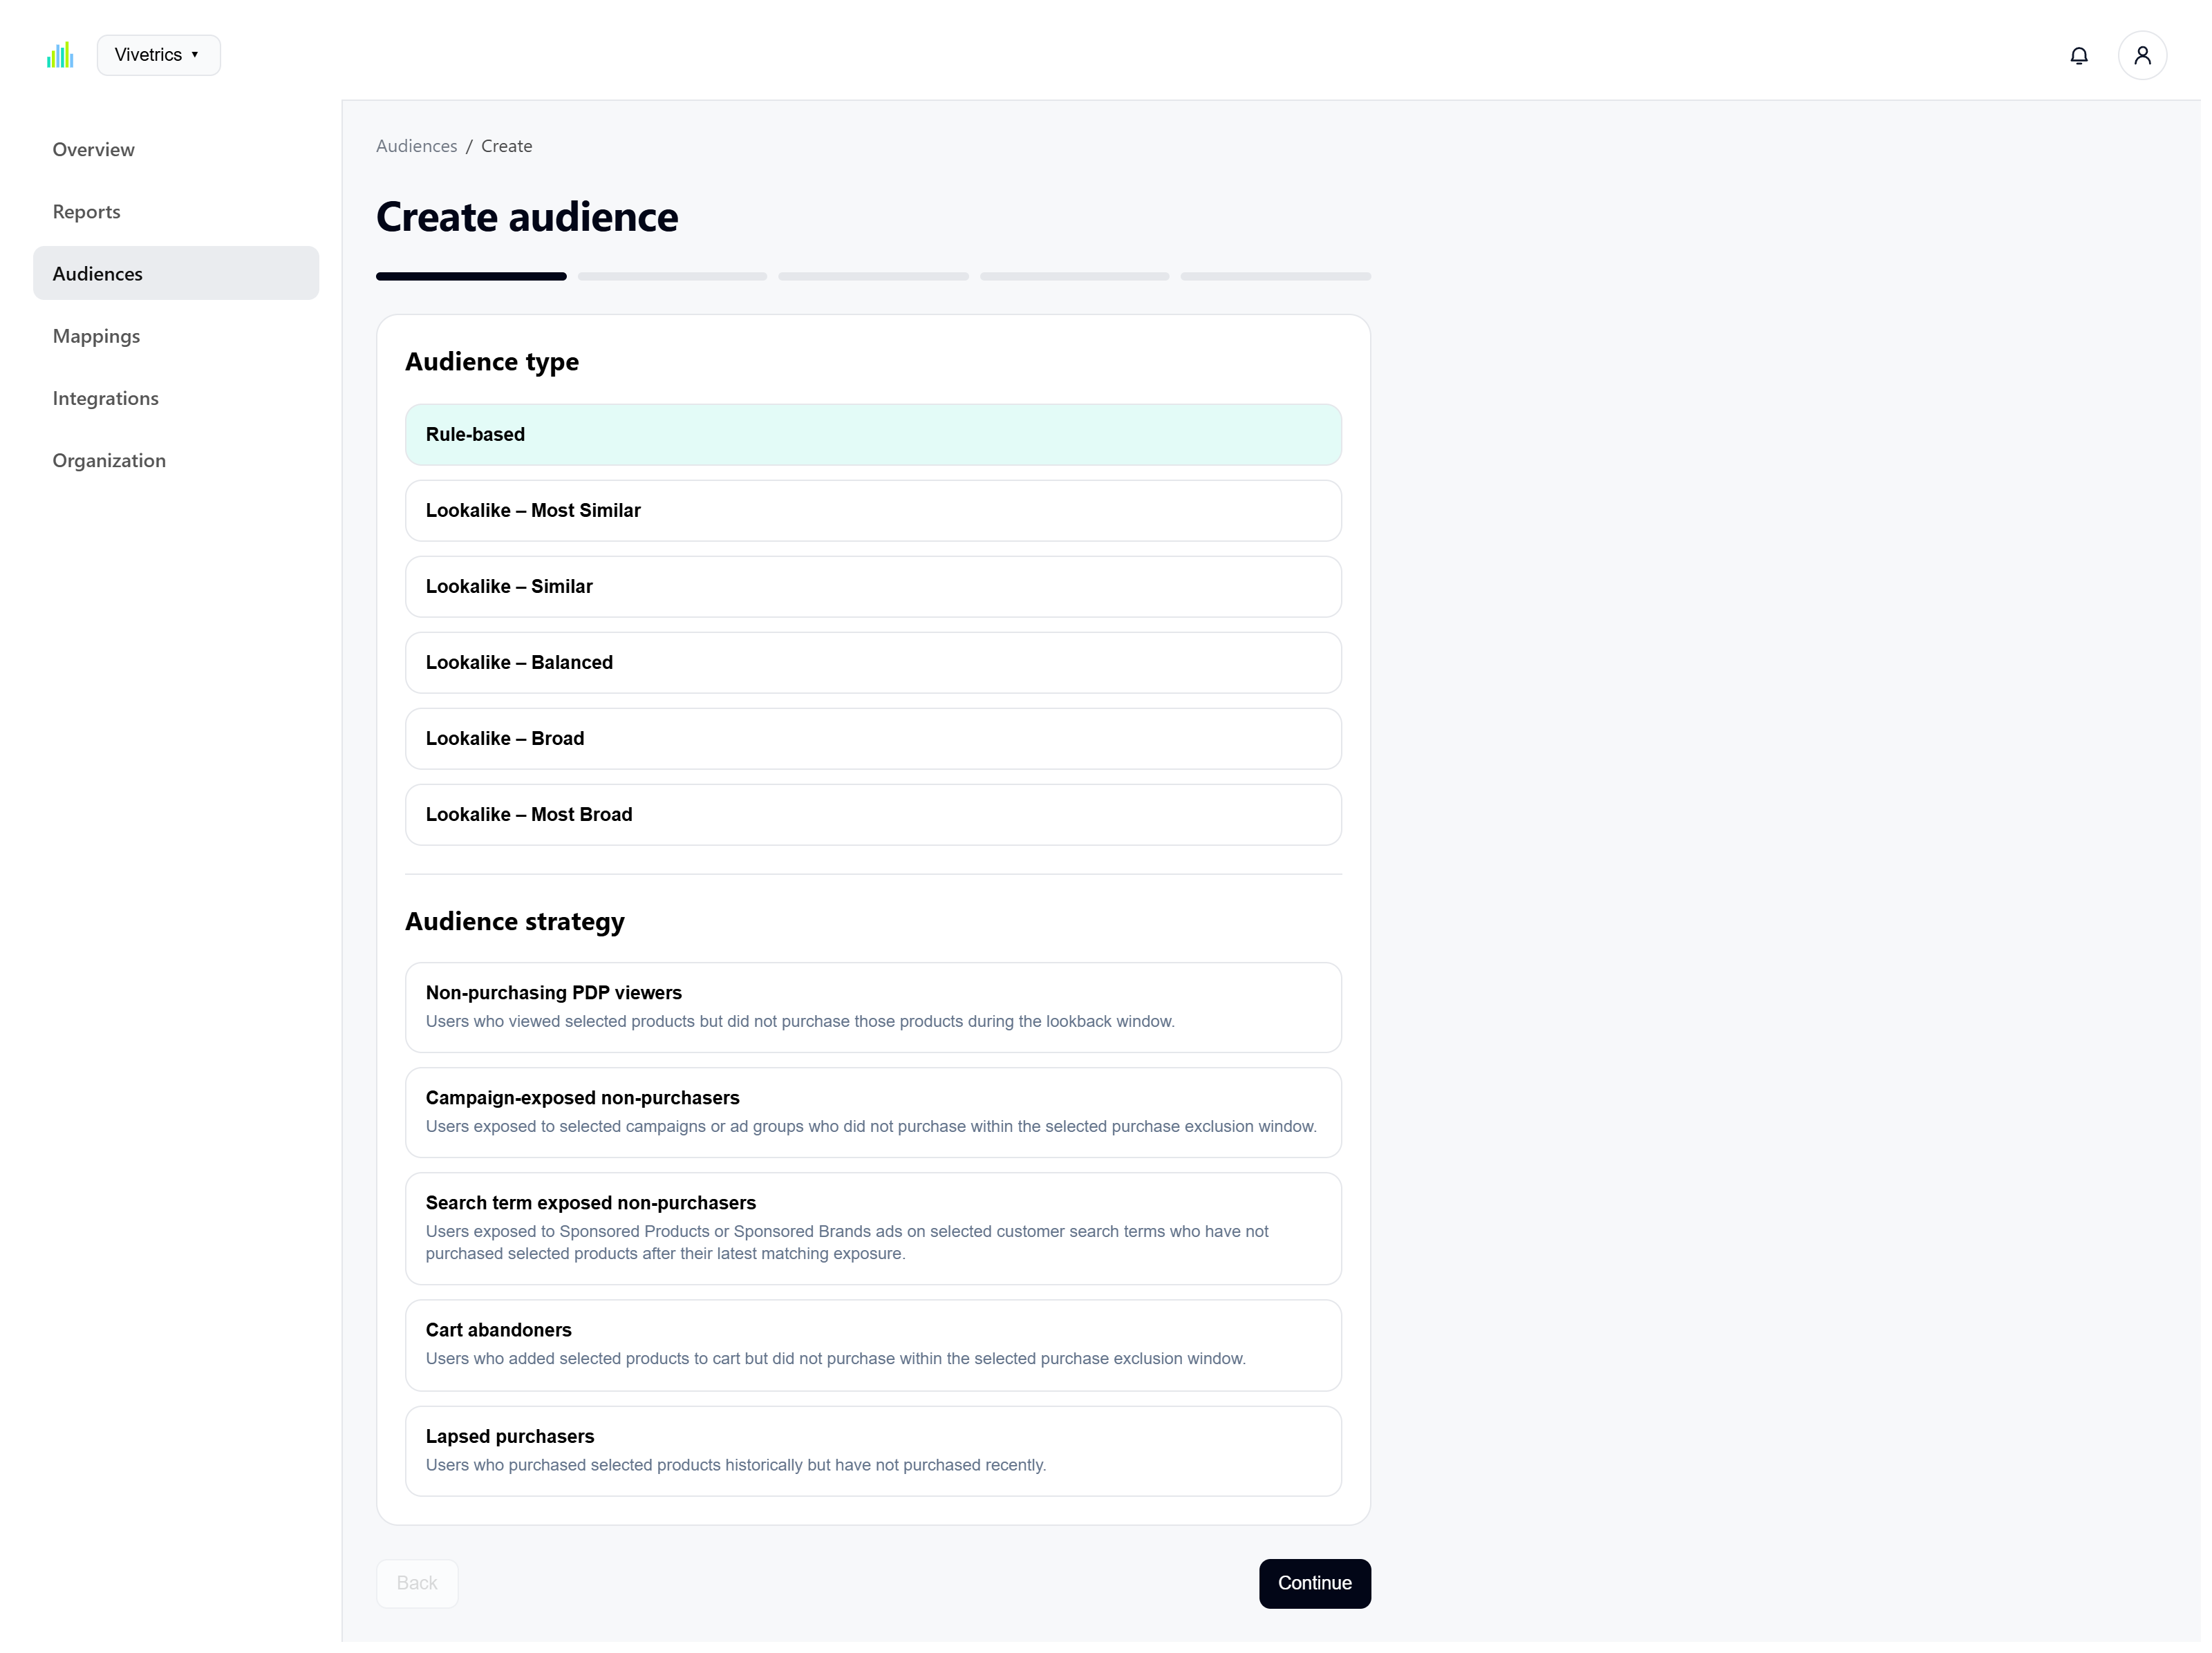
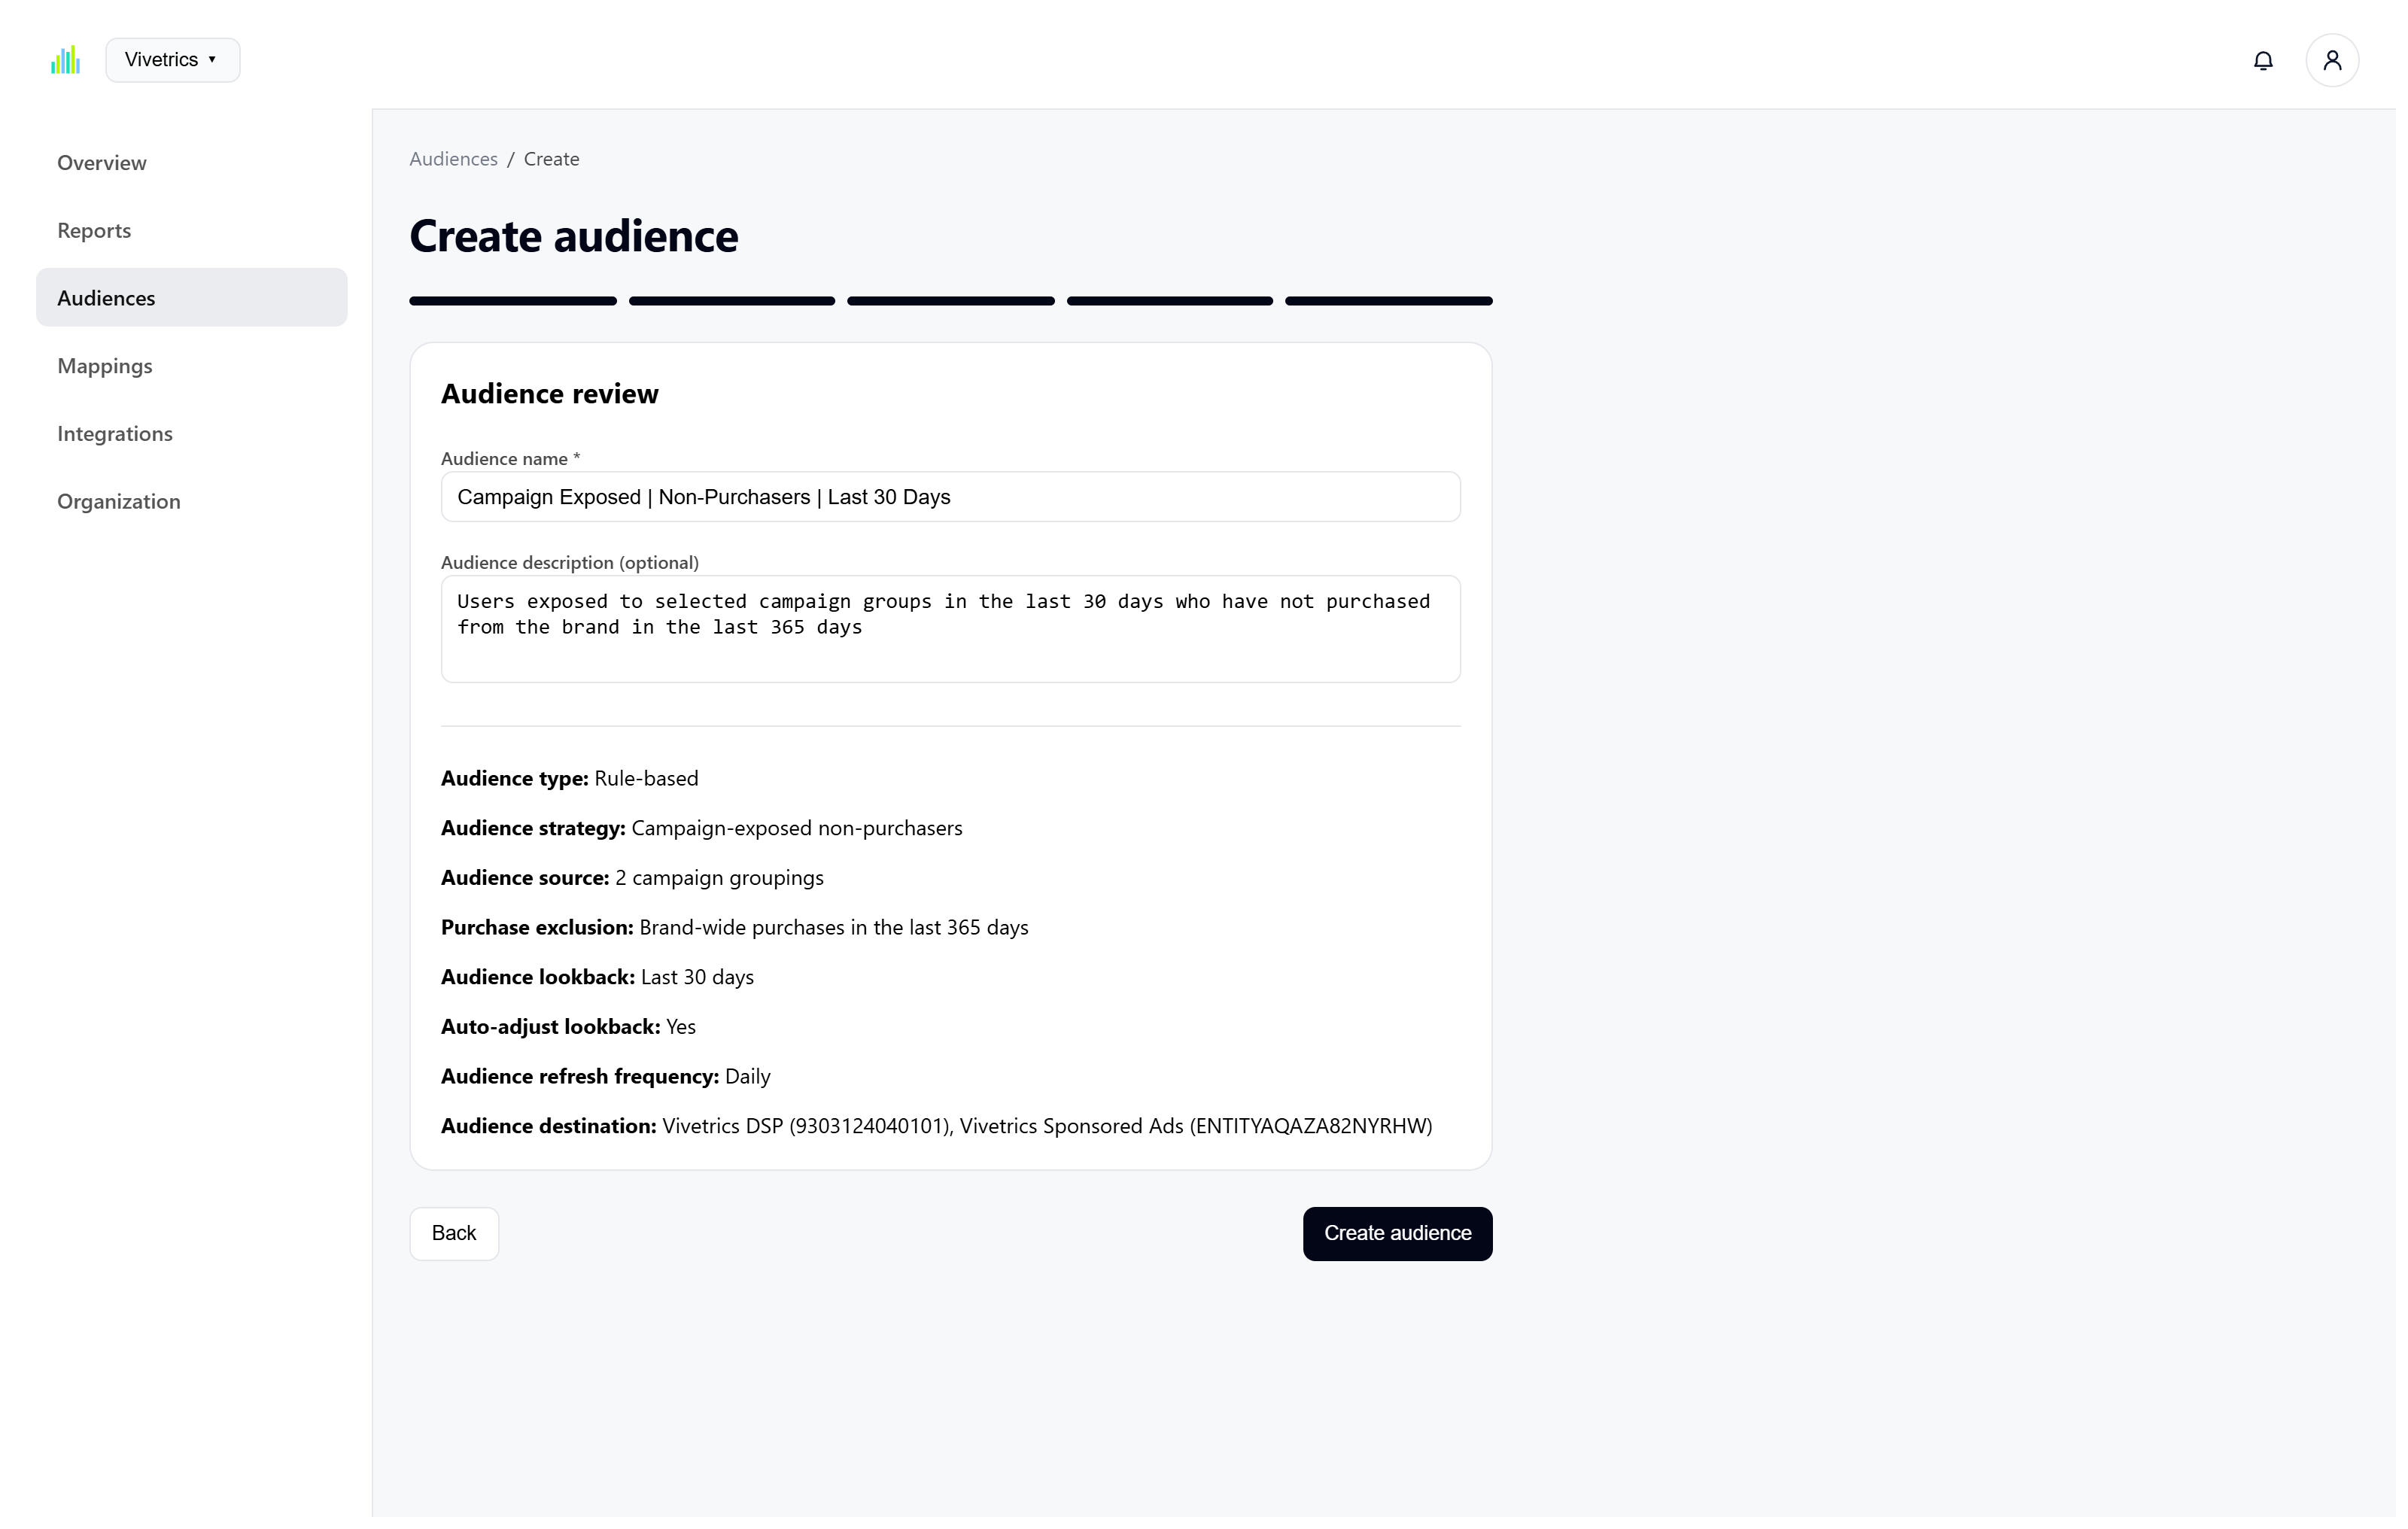
Vivetrics guides users through the decisions needed to define, review, and create supported AMC audience workflows.
Strategy
Select the supported behavior or outcome the audience should represent.
Source
Choose the mapped campaign, ad-group, product, or individual entity source.
Recency
Define the audience activity window and any purchase-exclusion window.
Destination
Select the available Amazon DSP or Sponsored Ads destination.
Refresh
Choose whether and how frequently the audience should be refreshed.
Review
Confirm the full audience configuration before creating it.
Decision supported
Confirm that audience intent, source logic, exclusion rules, recency, refresh behavior, and destinations remain aligned before creation.
One shared foundation
These use cases become repeatable when the operating context is shared.
Vivetrics uses workspace configuration, synchronized Amazon Ads entities, reusable mappings, report execution history, and explicit audience settings across the use-case system.
- Connected Amazon Ads and selected AMC instance
- Included DSP and Sponsored Ads data sources
- Verified report storage
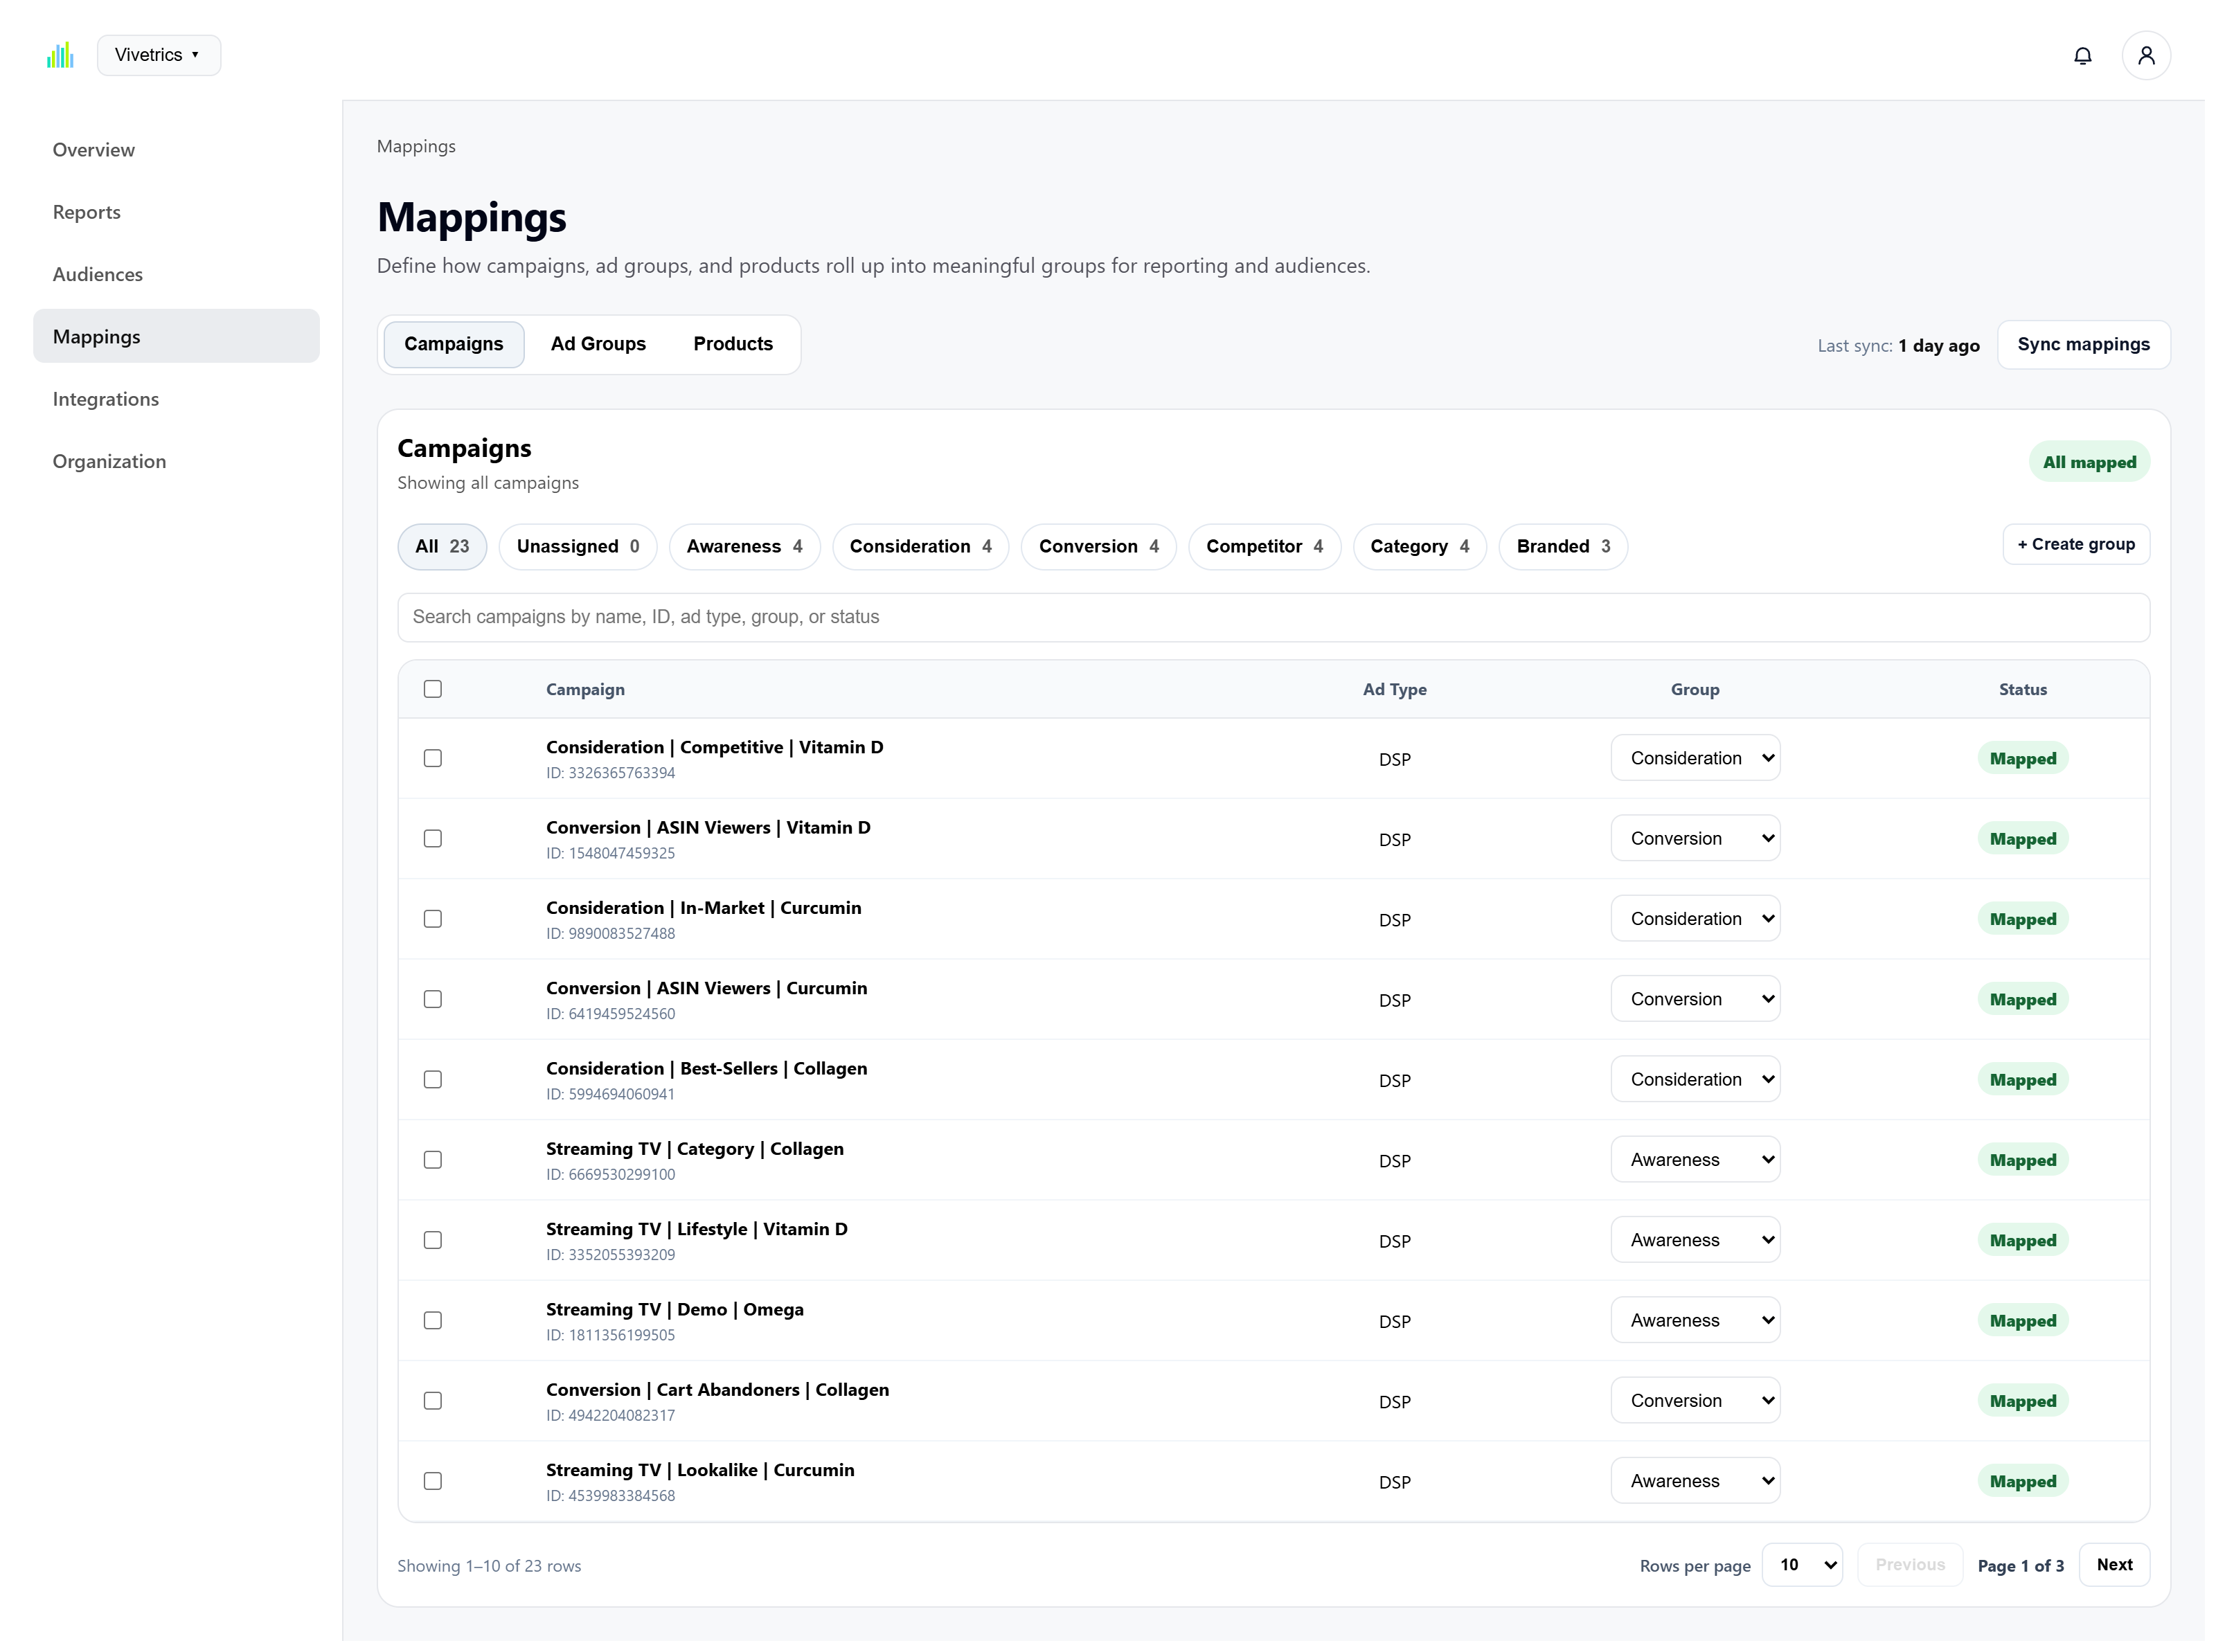
- Reusable campaign, ad-group, and product mappings
- Completed report output and run history
- Reviewable audience configuration
Bring your own AMC questions
See how Vivetrics fits the decisions your team already needs to make.
Demos are structured around the measurement, audience, and operational workflows most relevant to your organization.