


Reporting & Visualization
Our software solution offers automated reporting, real-time visualizations, and powerful analytics to enhance your Amazon DSP ecommerce advertising efforts.
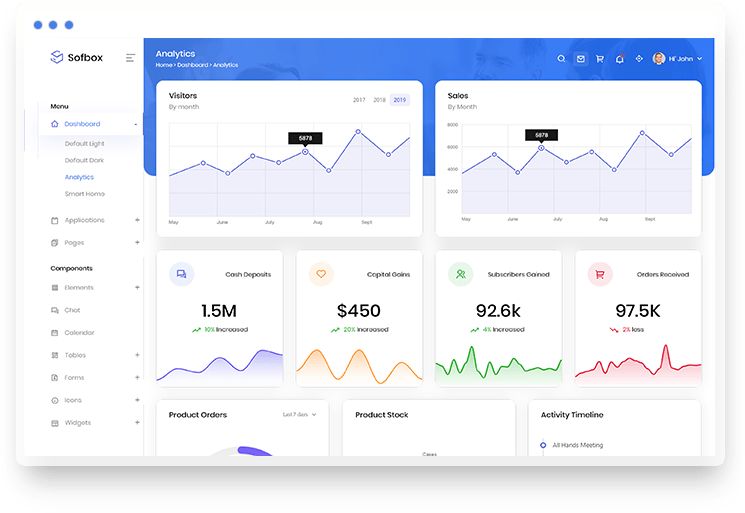
the Power of Visual Analytics.
We understand the challenges faced by Amazon DSP advertisers when it comes to analyzing and interpreting campaign performance data. That’s why we’ve developed a cutting-edge automated reporting and data visualization tool tailored specifically for Amazon DSP advertisers. Our tool empowers you to unlock the true potential of your advertising campaigns, gain valuable insights, and make data-driven decisions that drive success.
Data Visualization
Our interactive dashboards and charts present your data in a clear and actionable format, enabling you to quickly identify trends, patterns, and areas for improvement.
Customization
Tailor your reporting to focus on the metrics that matter most. Whether it's sales, ROAS, or any other KPI, our tool allows you to create personalized reports that align with your specific goals.
Gain Efficiencies
Our automated reporting and visualization tool saves time and resources. Instead of spending hours on manual analysis, you can focus on strategic decision-making.
Data Export
Seamlessly export your report and chart data visualizations to CSV, capture snapshots in PNG, create stunning visuals to incorporate into marketing materials with SVG, and more.


Streamlined Data Collection
We simplify the data collection process by seamlessly connecting with your Amazon DSP account. Whether you’re managing multiple campaigns or tracking performance across various regions, our tool fetches the relevant data and compiles it into a centralized hub.
Data Blending and Unification
Merge data from multiple sources into a cohesive and unified view. Our tool enables you to create custom data sets and gain a comprehensive understanding of your advertising performance.
User-Friendly Interface
We prioritized user experience, designing an intuitive and user-friendly interface that makes it easy for you to navigate and make the most of our tool's capabilities.
Expertise in Amazon DSP Advertising
We have a deep understanding of the intricacies of Amazon’s DSP. Our team of experts has developed this tool with years of experience and insights, ensuring it addresses the specific needs of Amazon DSP advertisers.
Actionable Insights
Our tool goes beyond raw data, providing you with actionable insights that drive tangible results. Leverage these insights to optimize your campaigns, increase efficiency, and achieve your advertising goals.
Performance Optimization
We help identify opportunities to optimize your campaigns. Enabling you to refine your targeting, adjust budgets, and make informed decisions that boost campaign performance.
")
Storytelling, Alerts, & Collaboration
Infographics
Transform your data into a compelling narrative. Our tool enables you to weave a story around your data with visual elements.
Social media visuals
Whether it's a sudden spike in conversions, a drop in CTR, or a potential optimization opportunity, our tool ensures that you stay informed and can take timely action.
Dashboards
Our tool allows for seamless data sharing and collaboration among team members, stakeholders, or clients.
LET'S GET STARTED
Are You Ready to Transform Your Data?
With Vivetrics’ ecommerce reporting & data visualization tool, you can unlock the true potential of your Amazon DSP campaigns. Gain deeper insights, optimize your strategies, and drive exceptional results. Experience the power of visualized data and elevate your ecommerce success today.
Newsletter